Перейти к основному содержимому

Monitoring Nginx with ClickStack

Quick Overview

This guide shows you how to capture distributed traces from Nginx and visualize them in ClickStack using copy/paste shell snippets.

In this simple example you'll see:

  • Real-time Nginx request traces with timing breakdowns
  • HTTP status codes, response times, and error rates
  • Interactive dashboards showing performance metrics

Approx Time: 5-10 minutes

Quick start

Create the project directory and configuration files

Copy/Paste these commands to create the necessary files for your nginx backend service.

Create Project Directory

mkdir nginx-clickstack-demo
cd nginx-clickstack-demo

Create docker-compose.yml

cat > docker-compose.yml << 'EOF'
services:
  clickstack:
    image: docker.hyperdx.io/hyperdx/hyperdx-all-in-one
    ports:
      - "8080:8080"
      - "4317:4317"
      - "4318:4318"
    networks:
      - monitoring

  nginx:
    image: nginx:1.27-otel
    ports:
      - "8081:8081"
    volumes:
      - ./nginx.conf:/etc/nginx/nginx.conf:ro
    extra_hosts:
      - "host.docker.internal:host-gateway"
    depends_on:
      - clickstack
    networks:
      - monitoring

networks:
  monitoring:
    driver: bridge
EOF

Create nginx.conf

cat > nginx.conf << 'EOF'
load_module modules/ngx_otel_module.so;

events {
    worker_connections 1024;
}

http {
    include mime.types;
    default_type application/octet-stream;

    otel_exporter {
        endpoint host.docker.internal:4317;
        header authorization PASTE_YOUR_API_KEY_HERE;
    }

    otel_service_name "nginx-proxy";

    server {
        listen 8081;
        server_name localhost;

        location / {
            otel_trace on;
            otel_trace_context propagate;
            otel_span_name "$request_method $uri";
            
            otel_span_attr http.status_code $status;
            otel_span_attr http.request.method $request_method;
            otel_span_attr http.route $uri;
            otel_span_attr http.user_agent "$http_user_agent";
            otel_span_attr http.client_ip $remote_addr;
            otel_span_attr nginx.request.time $request_time;
            otel_span_attr nginx.upstream.response.time $upstream_response_time;
            otel_span_attr nginx.upstream.connect.time $upstream_connect_time;
            otel_span_attr nginx.upstream.status $upstream_status;
            
            proxy_pass https://fakestoreapi.com;
            proxy_ssl_server_name on;
            proxy_ssl_name fakestoreapi.com;
            proxy_set_header Host fakestoreapi.com;
            proxy_set_header X-Real-IP $remote_addr;
            proxy_set_header X-Forwarded-For $proxy_add_x_forwarded_for;
        }
    }
}
EOF

Create generate_traffic.sh

This will create a shell script to generate realistic traffic at intervals of time to a fake store api. This will be the traffic we're monitoring.


cat > generate_traffic.sh << 'EOF'
#!/bin/bash

GOOD_ENDPOINTS=(
    "/products"
    "/products/1"
    "/products/2"
    "/products/3"
    "/products/category/electronics"
    "/products/category/jewelery"
    "/users"
    "/users/1"
)

BAD_ENDPOINTS=(
    "/products/99999"
    "/users/99999"
    "/nonexistent"
)

BASE_URL="http://localhost:8081"

echo "Generating traffic to nginx..."
echo "Press Ctrl+C to stop"
echo ""

REQUEST_COUNT=0

while true; do
    if (( RANDOM % 100 < 80 )); then
        ENDPOINT=${GOOD_ENDPOINTS[$RANDOM % ${#GOOD_ENDPOINTS[@]}]}
    else
        ENDPOINT=${BAD_ENDPOINTS[$RANDOM % ${#BAD_ENDPOINTS[@]}]}
    fi
    
    STATUS=$(curl -s -o /dev/null -w "%{http_code}" "${BASE_URL}${ENDPOINT}")
    ((REQUEST_COUNT++))
    
    if [[ $STATUS == 2* ]]; then
        COLOR='\033[0;32m'
    elif [[ $STATUS == 4* ]]; then
        COLOR='\033[0;33m'
    else
        COLOR='\033[0;31m'
    fi
    
    echo -e "${COLOR}[$REQUEST_COUNT] $STATUS - $ENDPOINT\033[0m"
    
    sleep $(awk 'BEGIN{srand(); print 0.5+rand()*2.5}')
done
EOF

chmod +x generate_traffic.sh

Start ClickStack and create your account

docker-compose up -d clickstack

Wait 30-60 seconds for ClickStack to fully initialize, then:

  1. Open http://localhost:8080 in your browser
  2. Create an account with a username and strong password
  3. Go to Settings → API Keys
  4. Copy your Ingestion API Key

Configure nginx with your api key

Open nginx.conf in a text editor and replace PASTE_YOUR_API_KEY_HERE with your actual API key.

    otel_exporter {
        endpoint host.docker.internal:4317;
        header authorization PASTE_YOUR_API_KEY_HERE;
    }

Start nginx

docker-compose up -d nginx

Verify both services are running

docker-compose ps

You should see both clickstack and nginx with status "Up".

Generate realistic traffic

Run the traffic generator to create traces.

./generate_traffic.sh

You'll see colorful output showing requests hitting various endpoints:

  • Green = successful (200)
  • Yellow = not found (404)
  • Red = errors (5xx)

Let it run for 1-2 minutes, then press Ctrl+C if you want to stop the traffic.
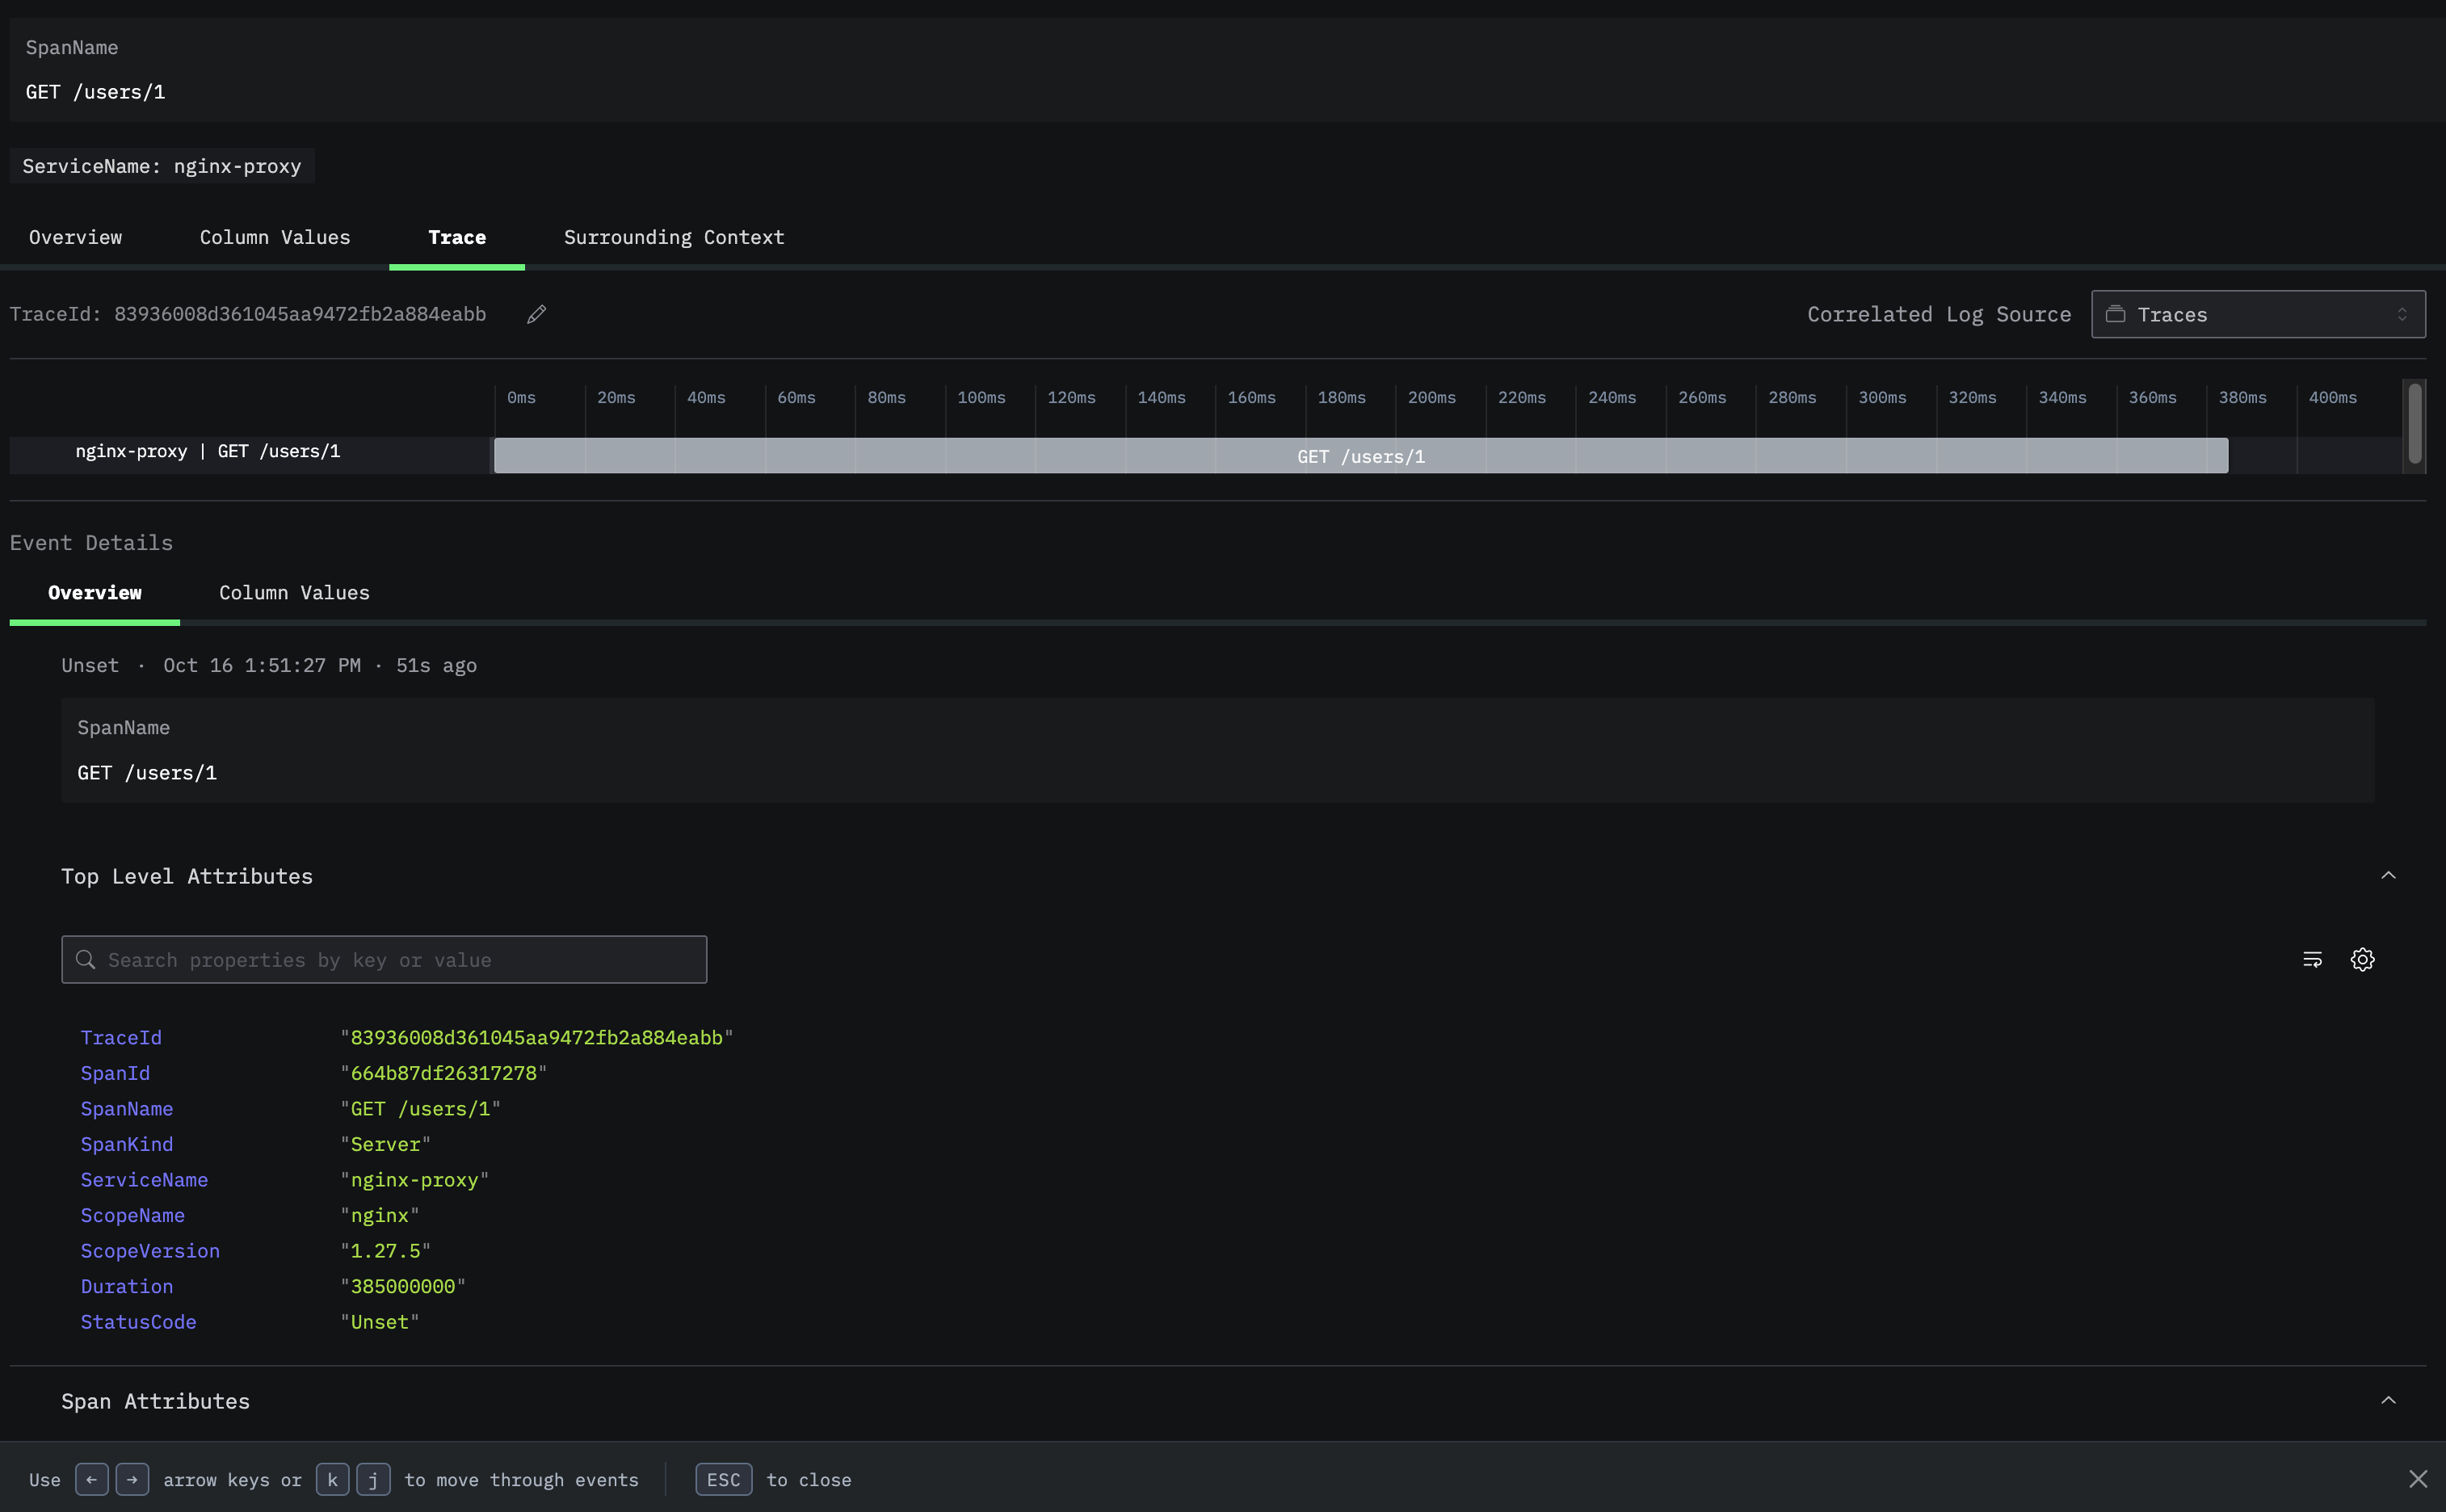
Explore your traces

Open ClickStack at http://localhost:8080 and explore:

  1. Go to Search and set your source to Traces
  2. Set time range to "Last 15 minutes"
  3. You'll see traces from the nginx-proxy service
  4. Click on any trace to see:
    • Total request duration
    • HTTP status code and method
    • Client IP and user agent
    • Span attributes
Try filtering:
  • http.status_code:404 - See all 404 errors
  • nginx.request.time:>200 - Slow requests (>200ms)
  • http.route:/products/1 - Specific endpoint

Creating Your First Dashboard

Let's create a dashboard to monitor nginx performance:

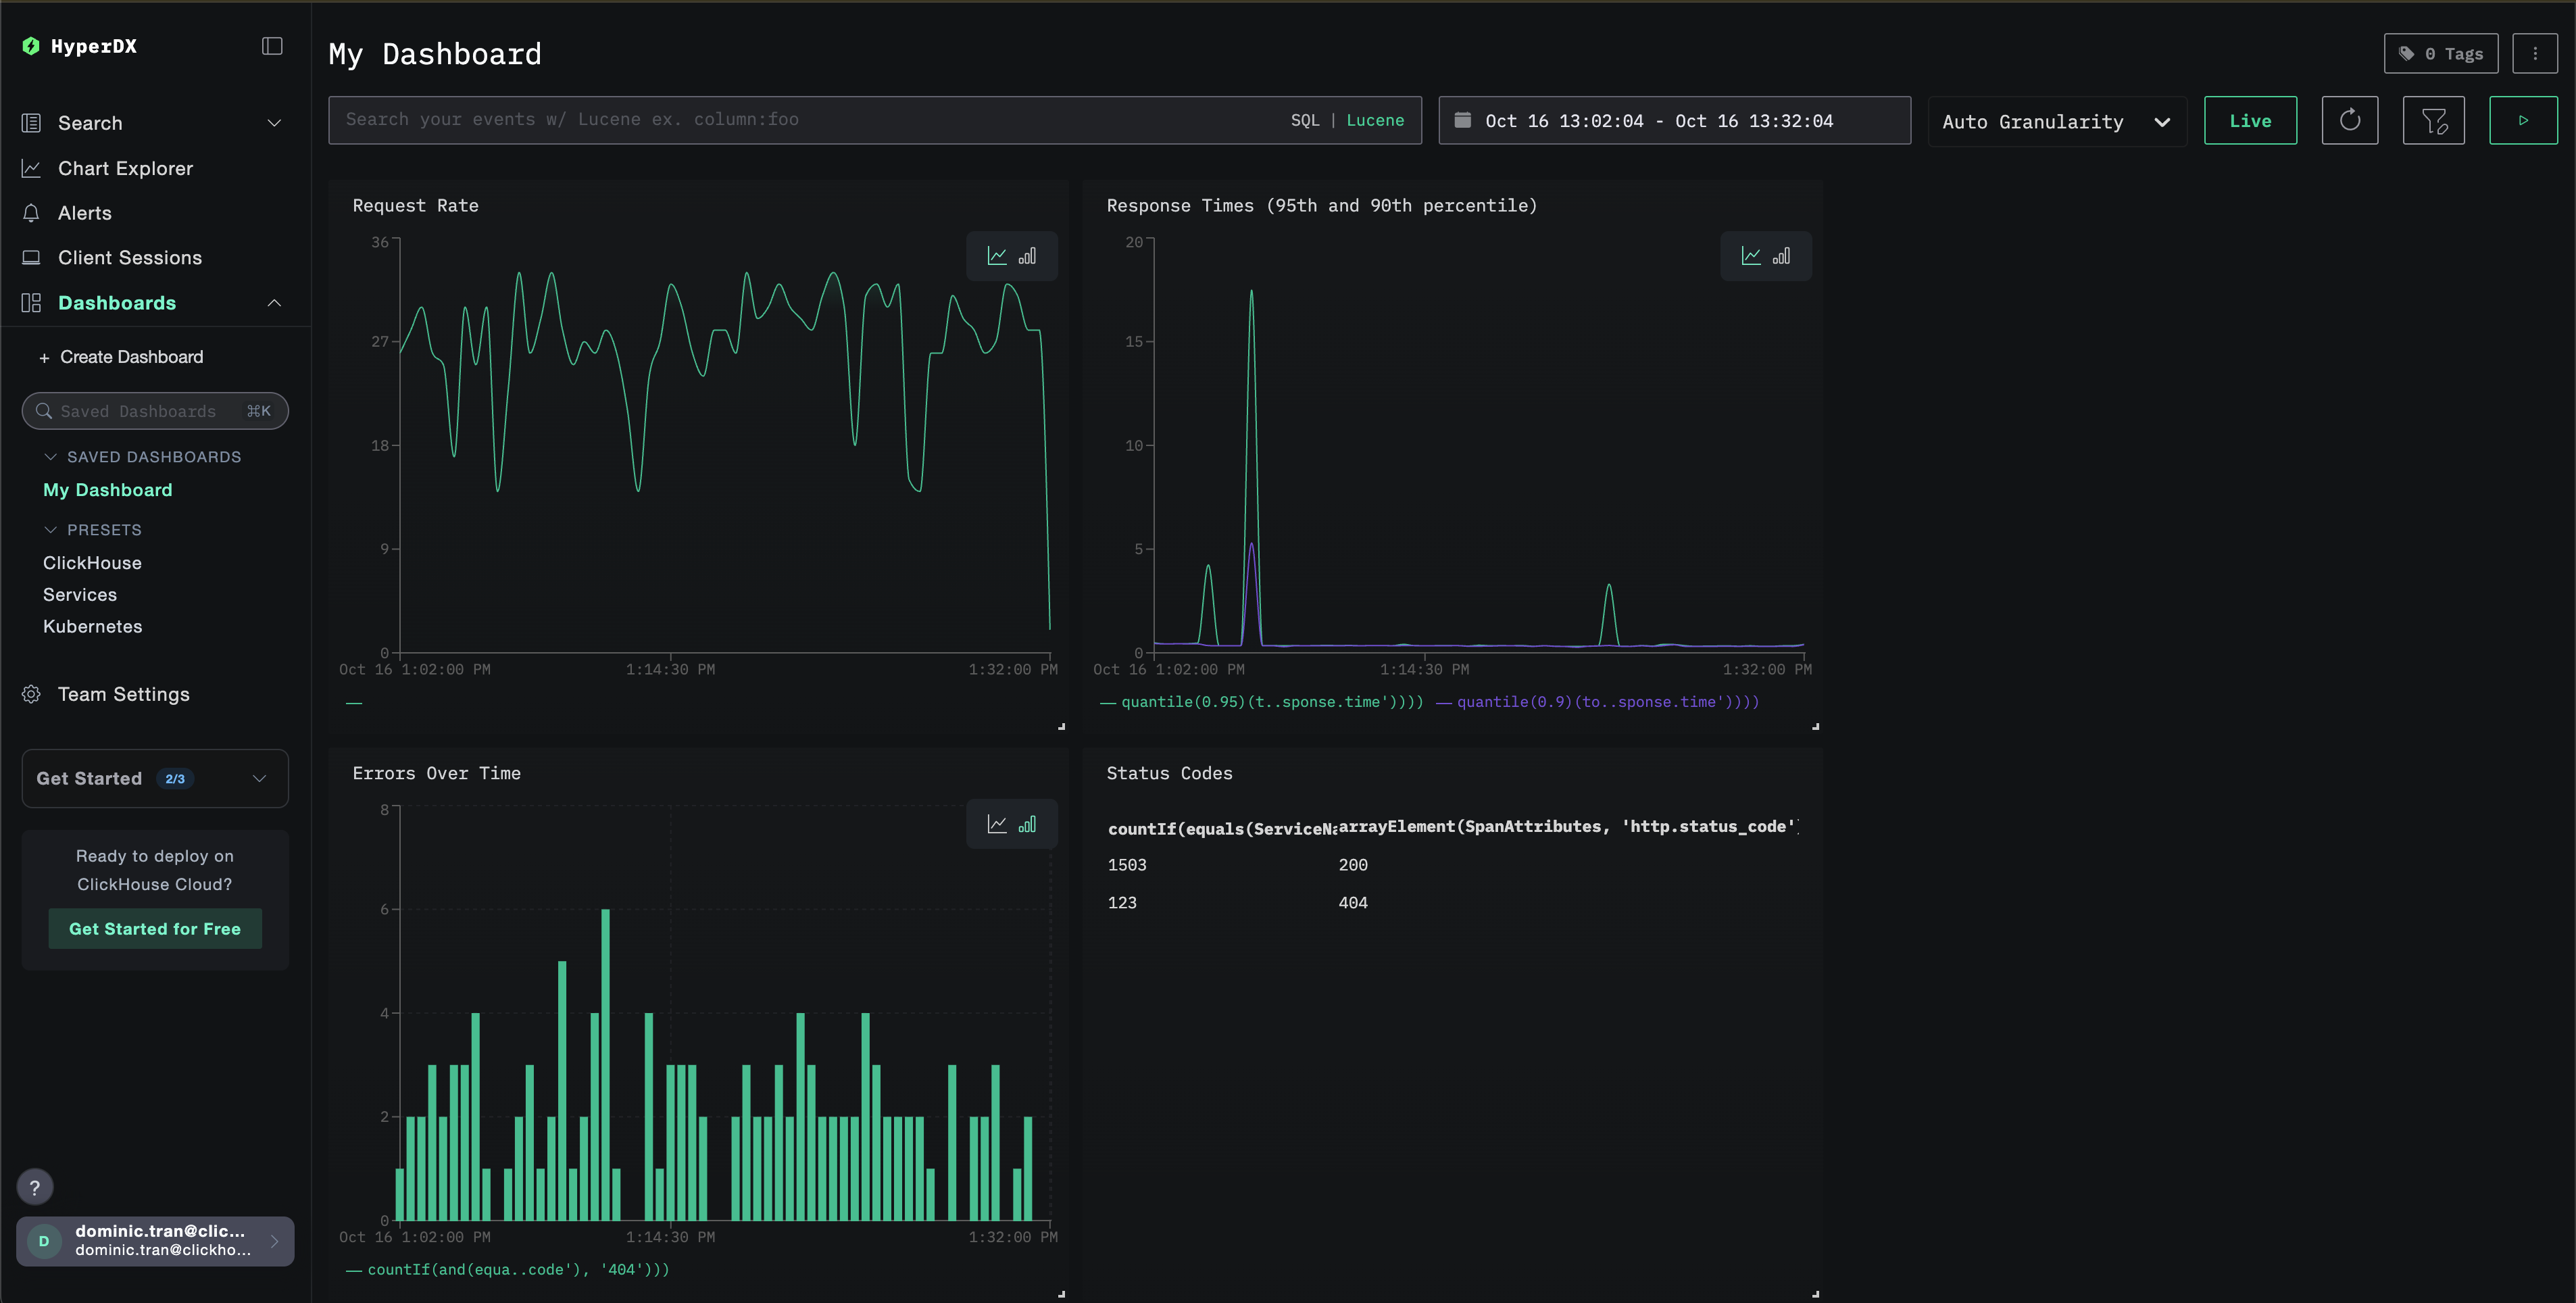
In HyperDX, go to Dashboards -> Create New Saved Dashboard

Add these charts:

Chart 1: Request Rate

  • Type: Line/Bar
  • Where: ServiceName:"nginx-proxy"
  • Aggregation: Count of Events
  • Group by: Events.Timestamp

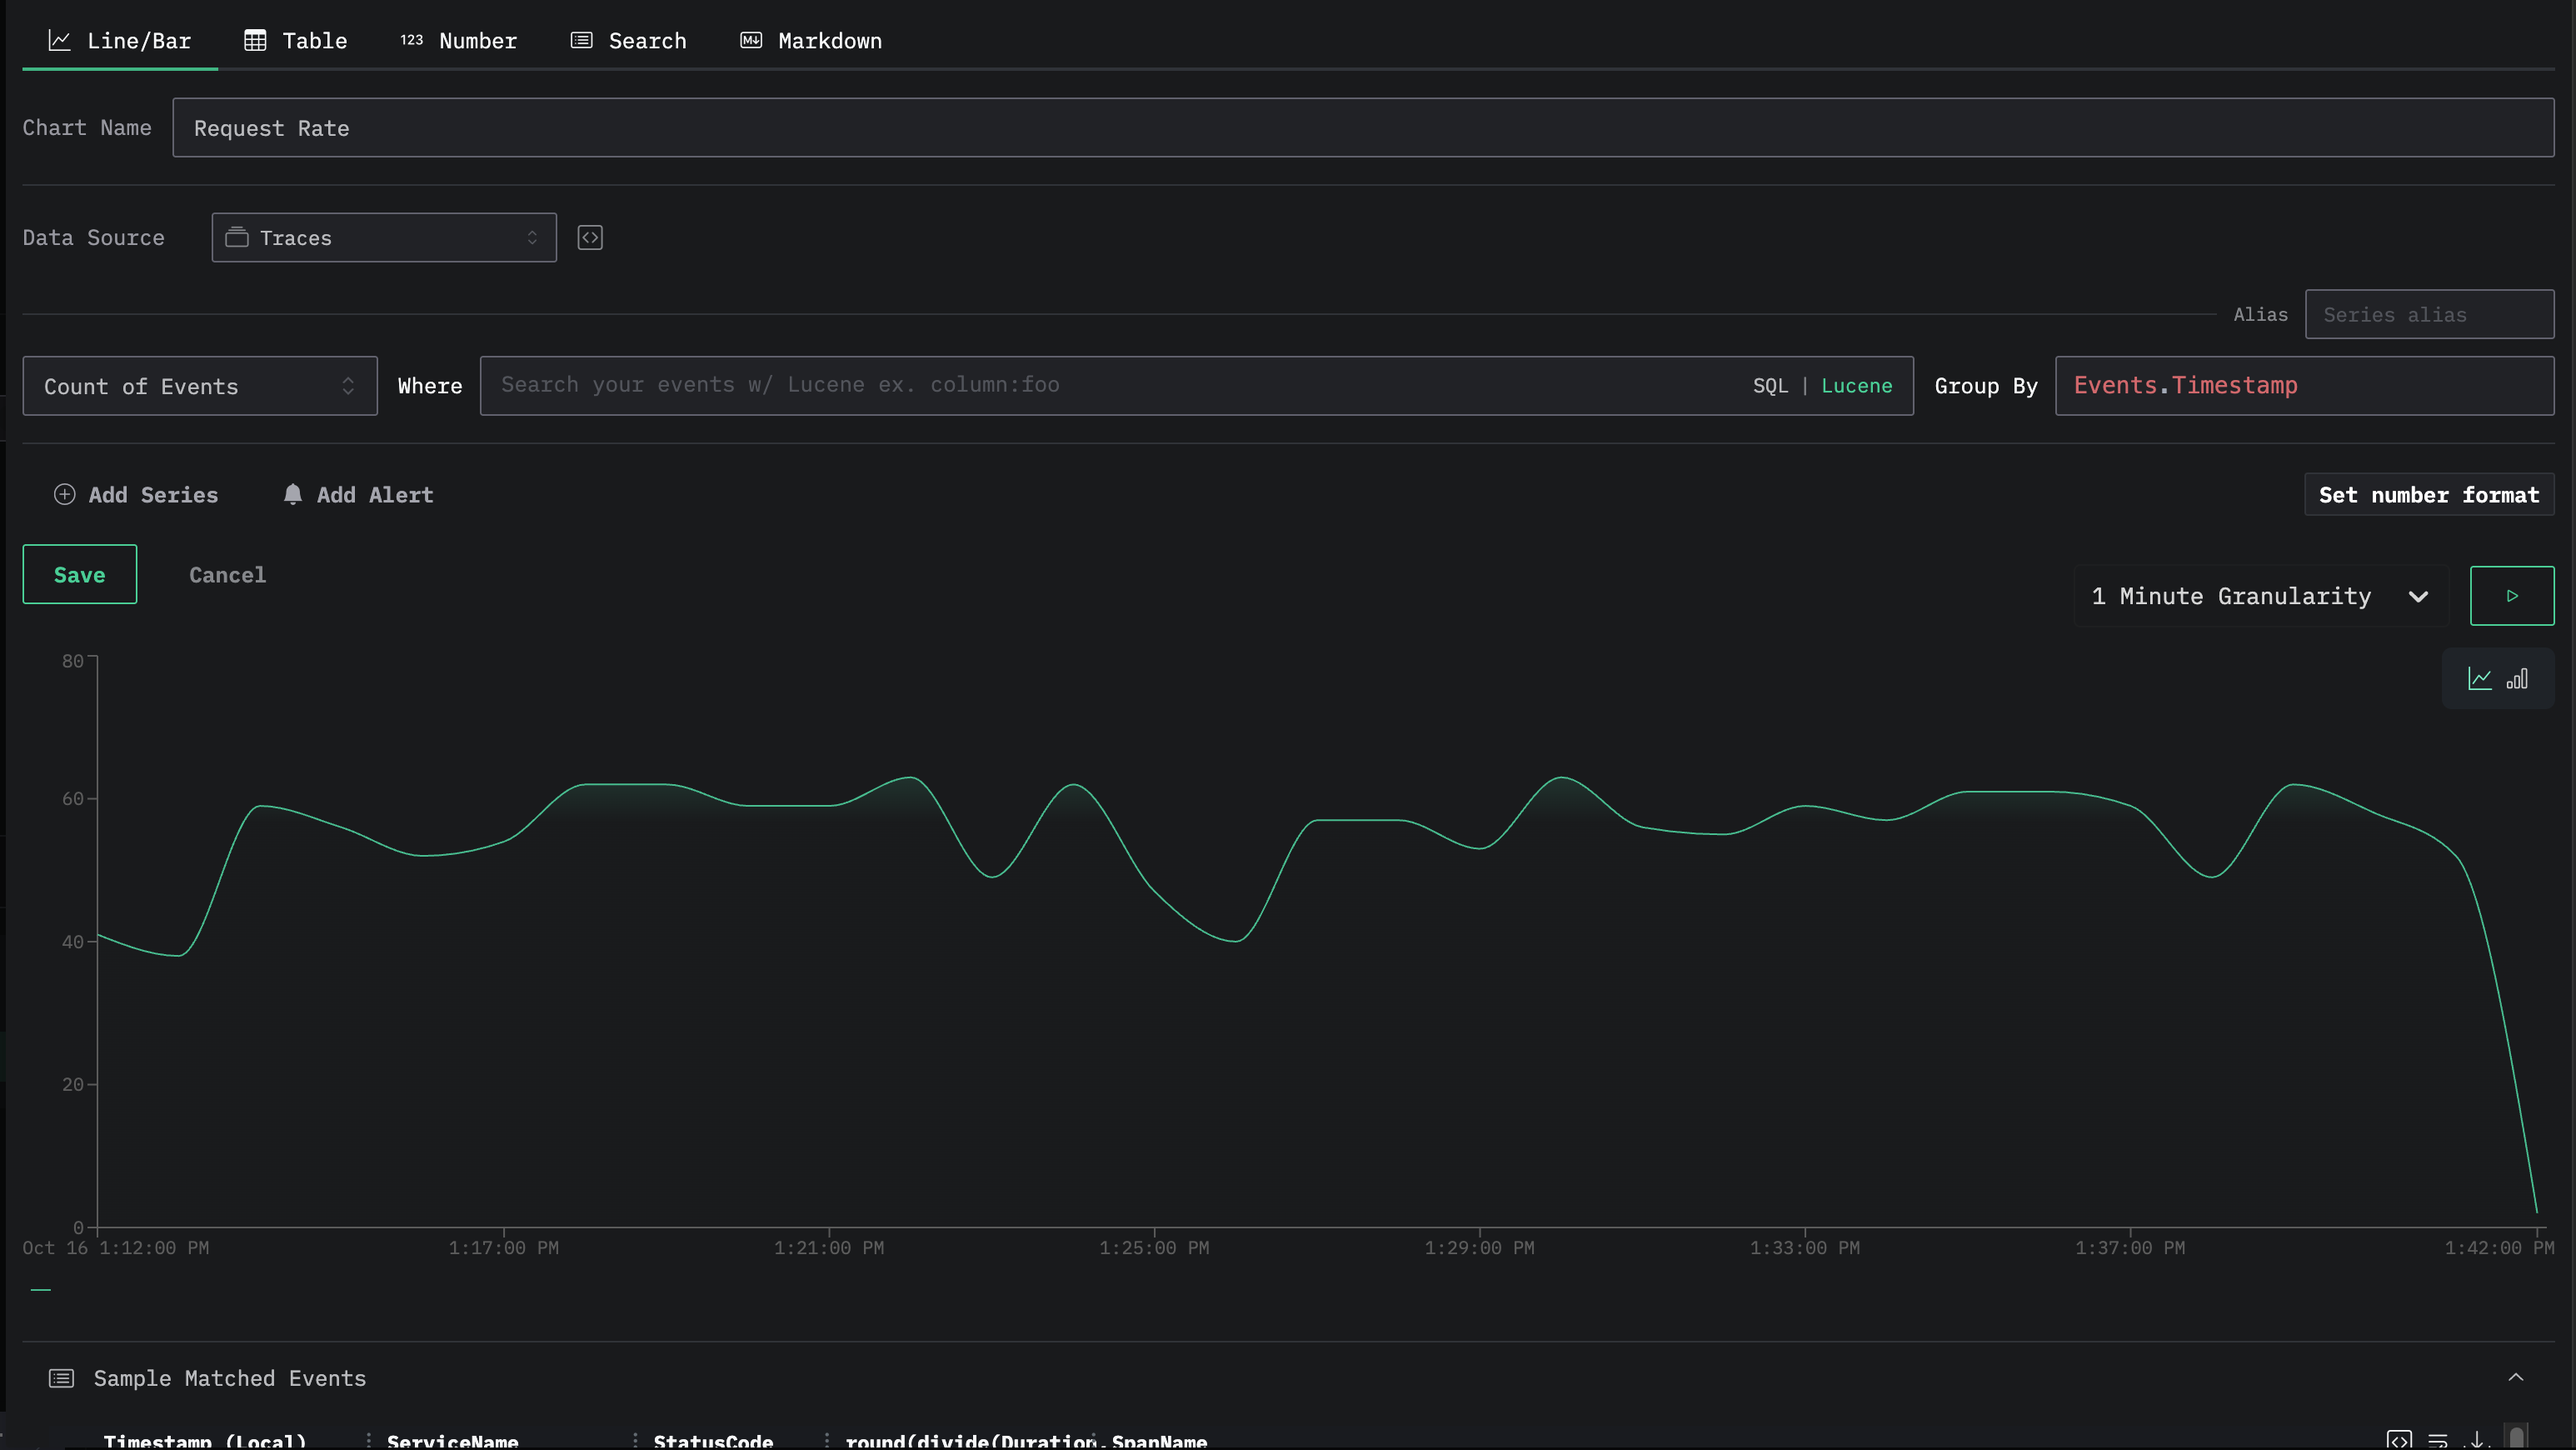
Chart 2: Response Times (95th and 90th percentile)

  • Type: Line/Bar
  • Where: ServiceName:"nginx-proxy"
  • Aggregation: 99th Percentile (You can click add series to add more aggregations, such as 95th percentile, and 90th percentile)
  • Group by: None
  • Granularity: Adjust this to see different trend lines in your data

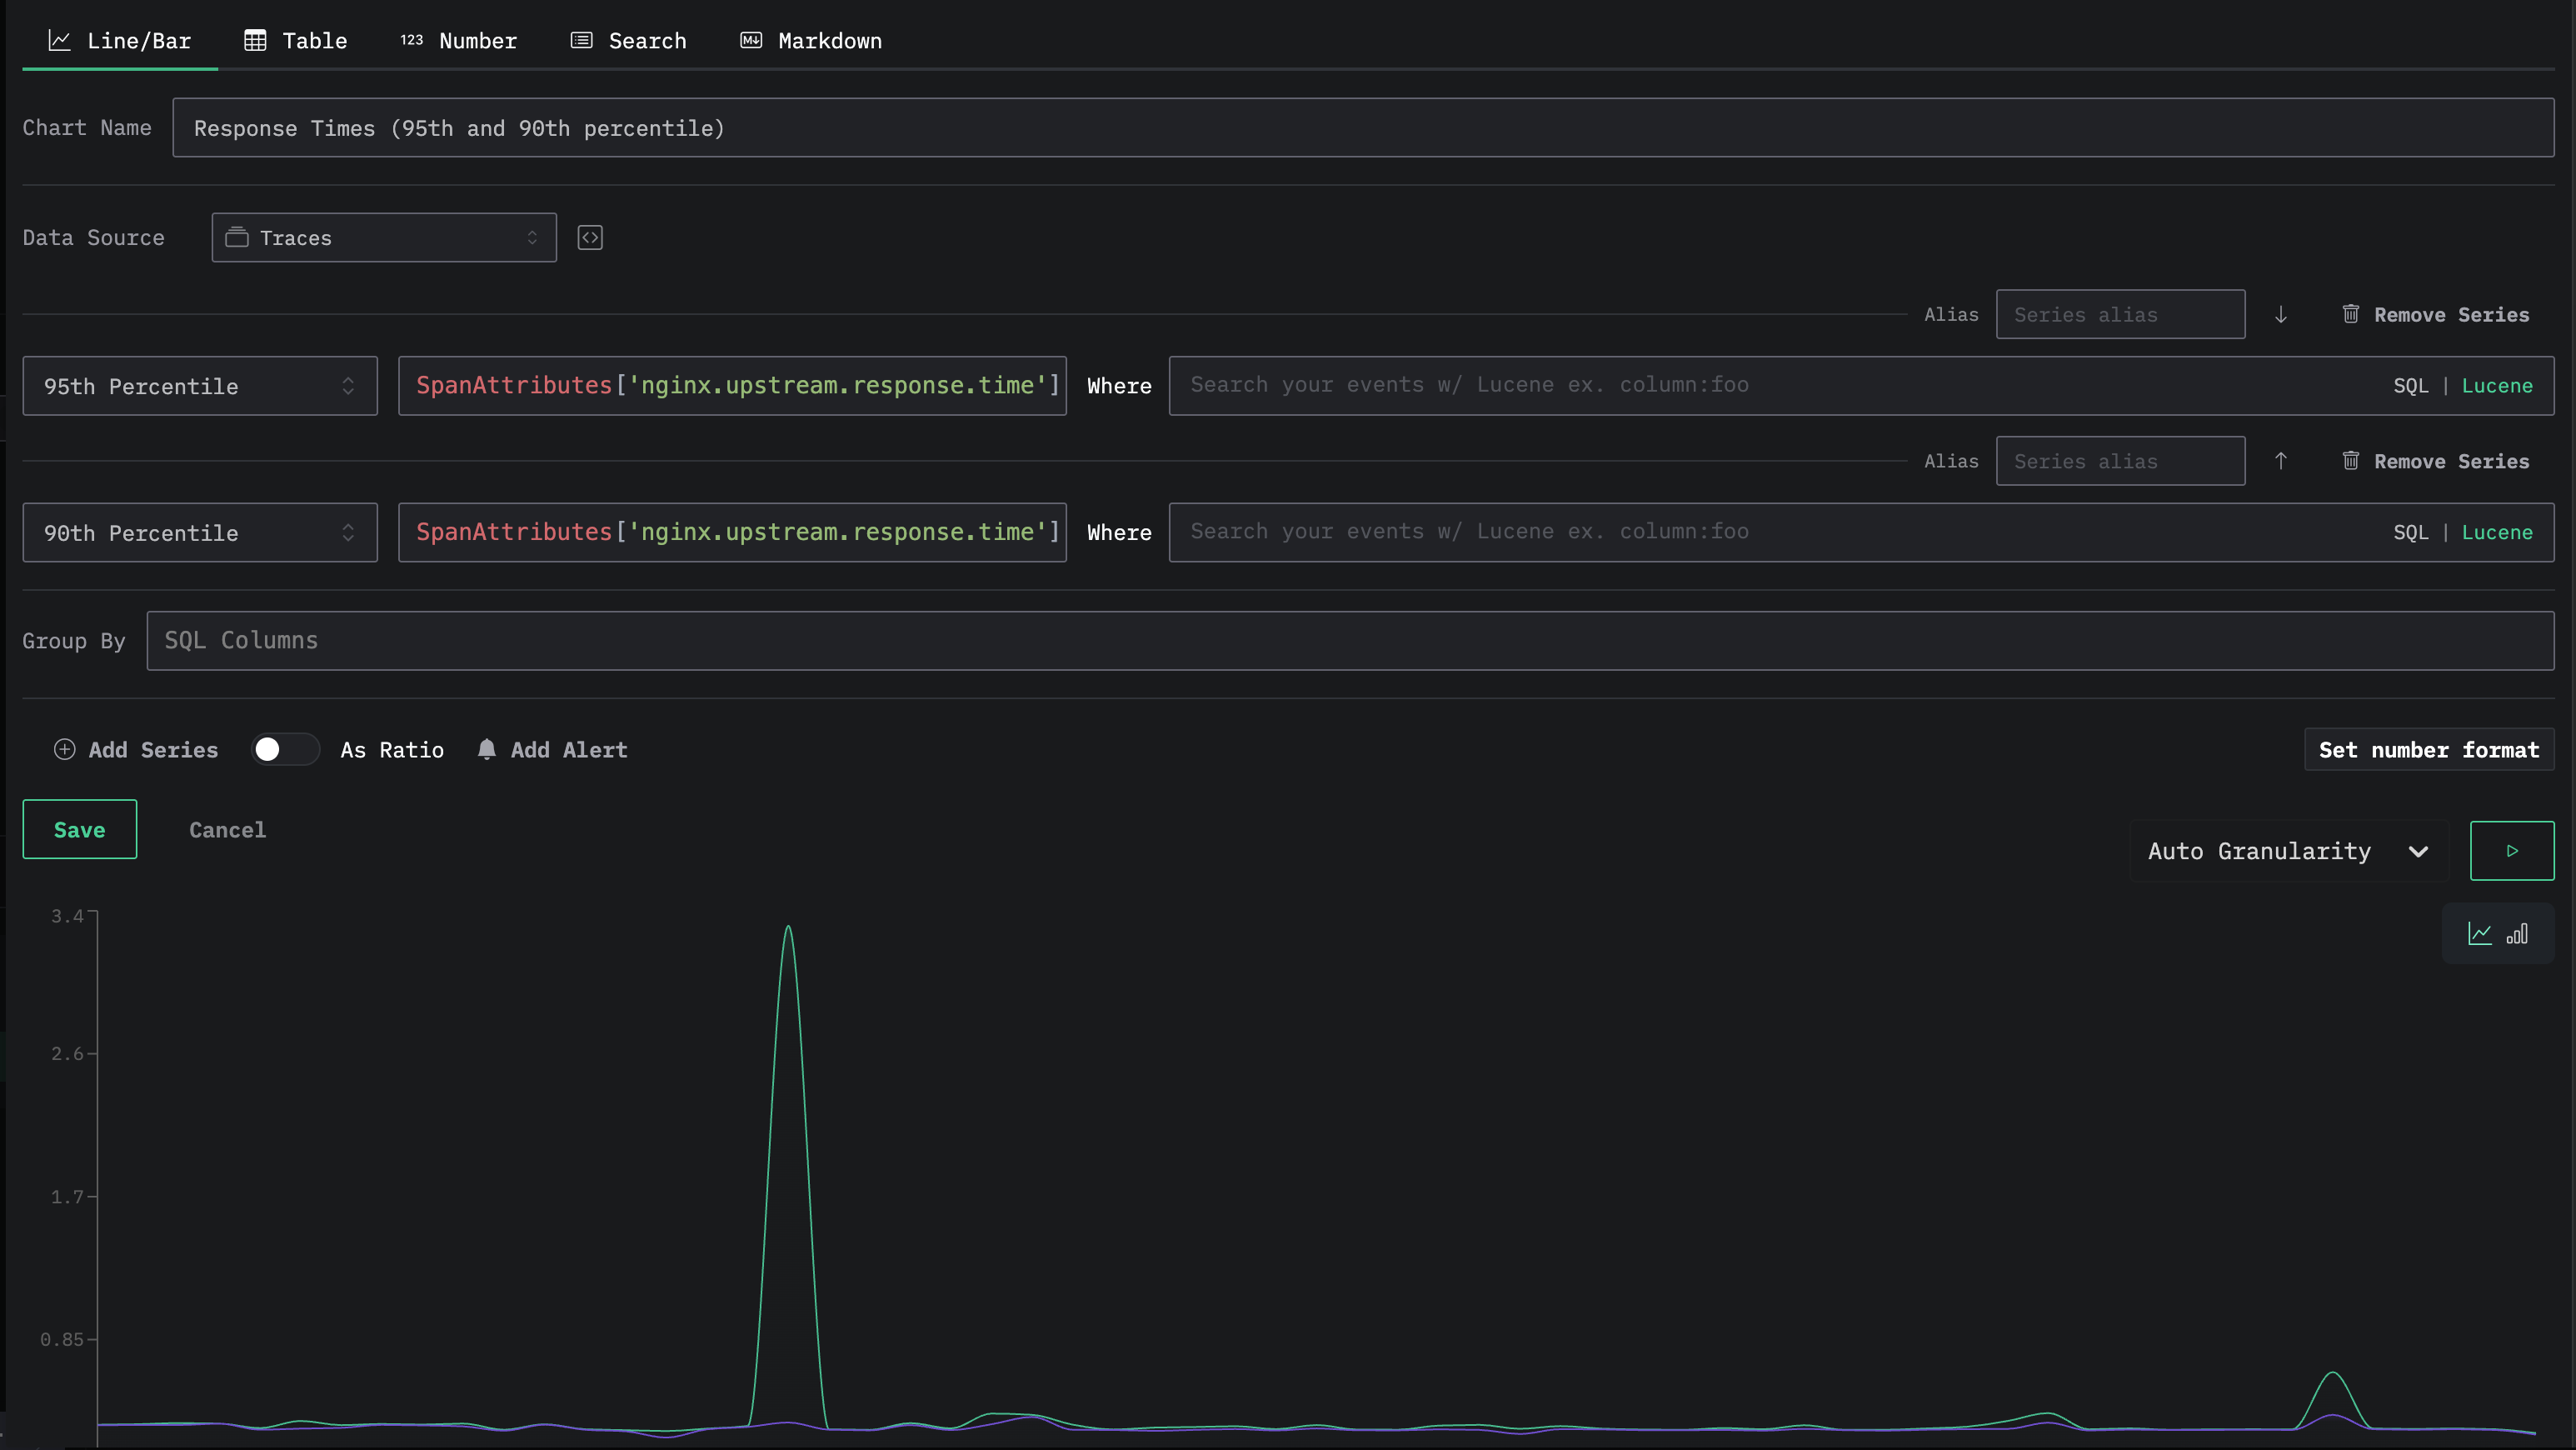
Chart 3: Errors Over Time

  • Type: Line/Bar
  • Where: ServiceName:"nginx-proxy" SpanAttributes.http.status_code:"404"
  • Aggregation: Count of Events
  • Group by: None

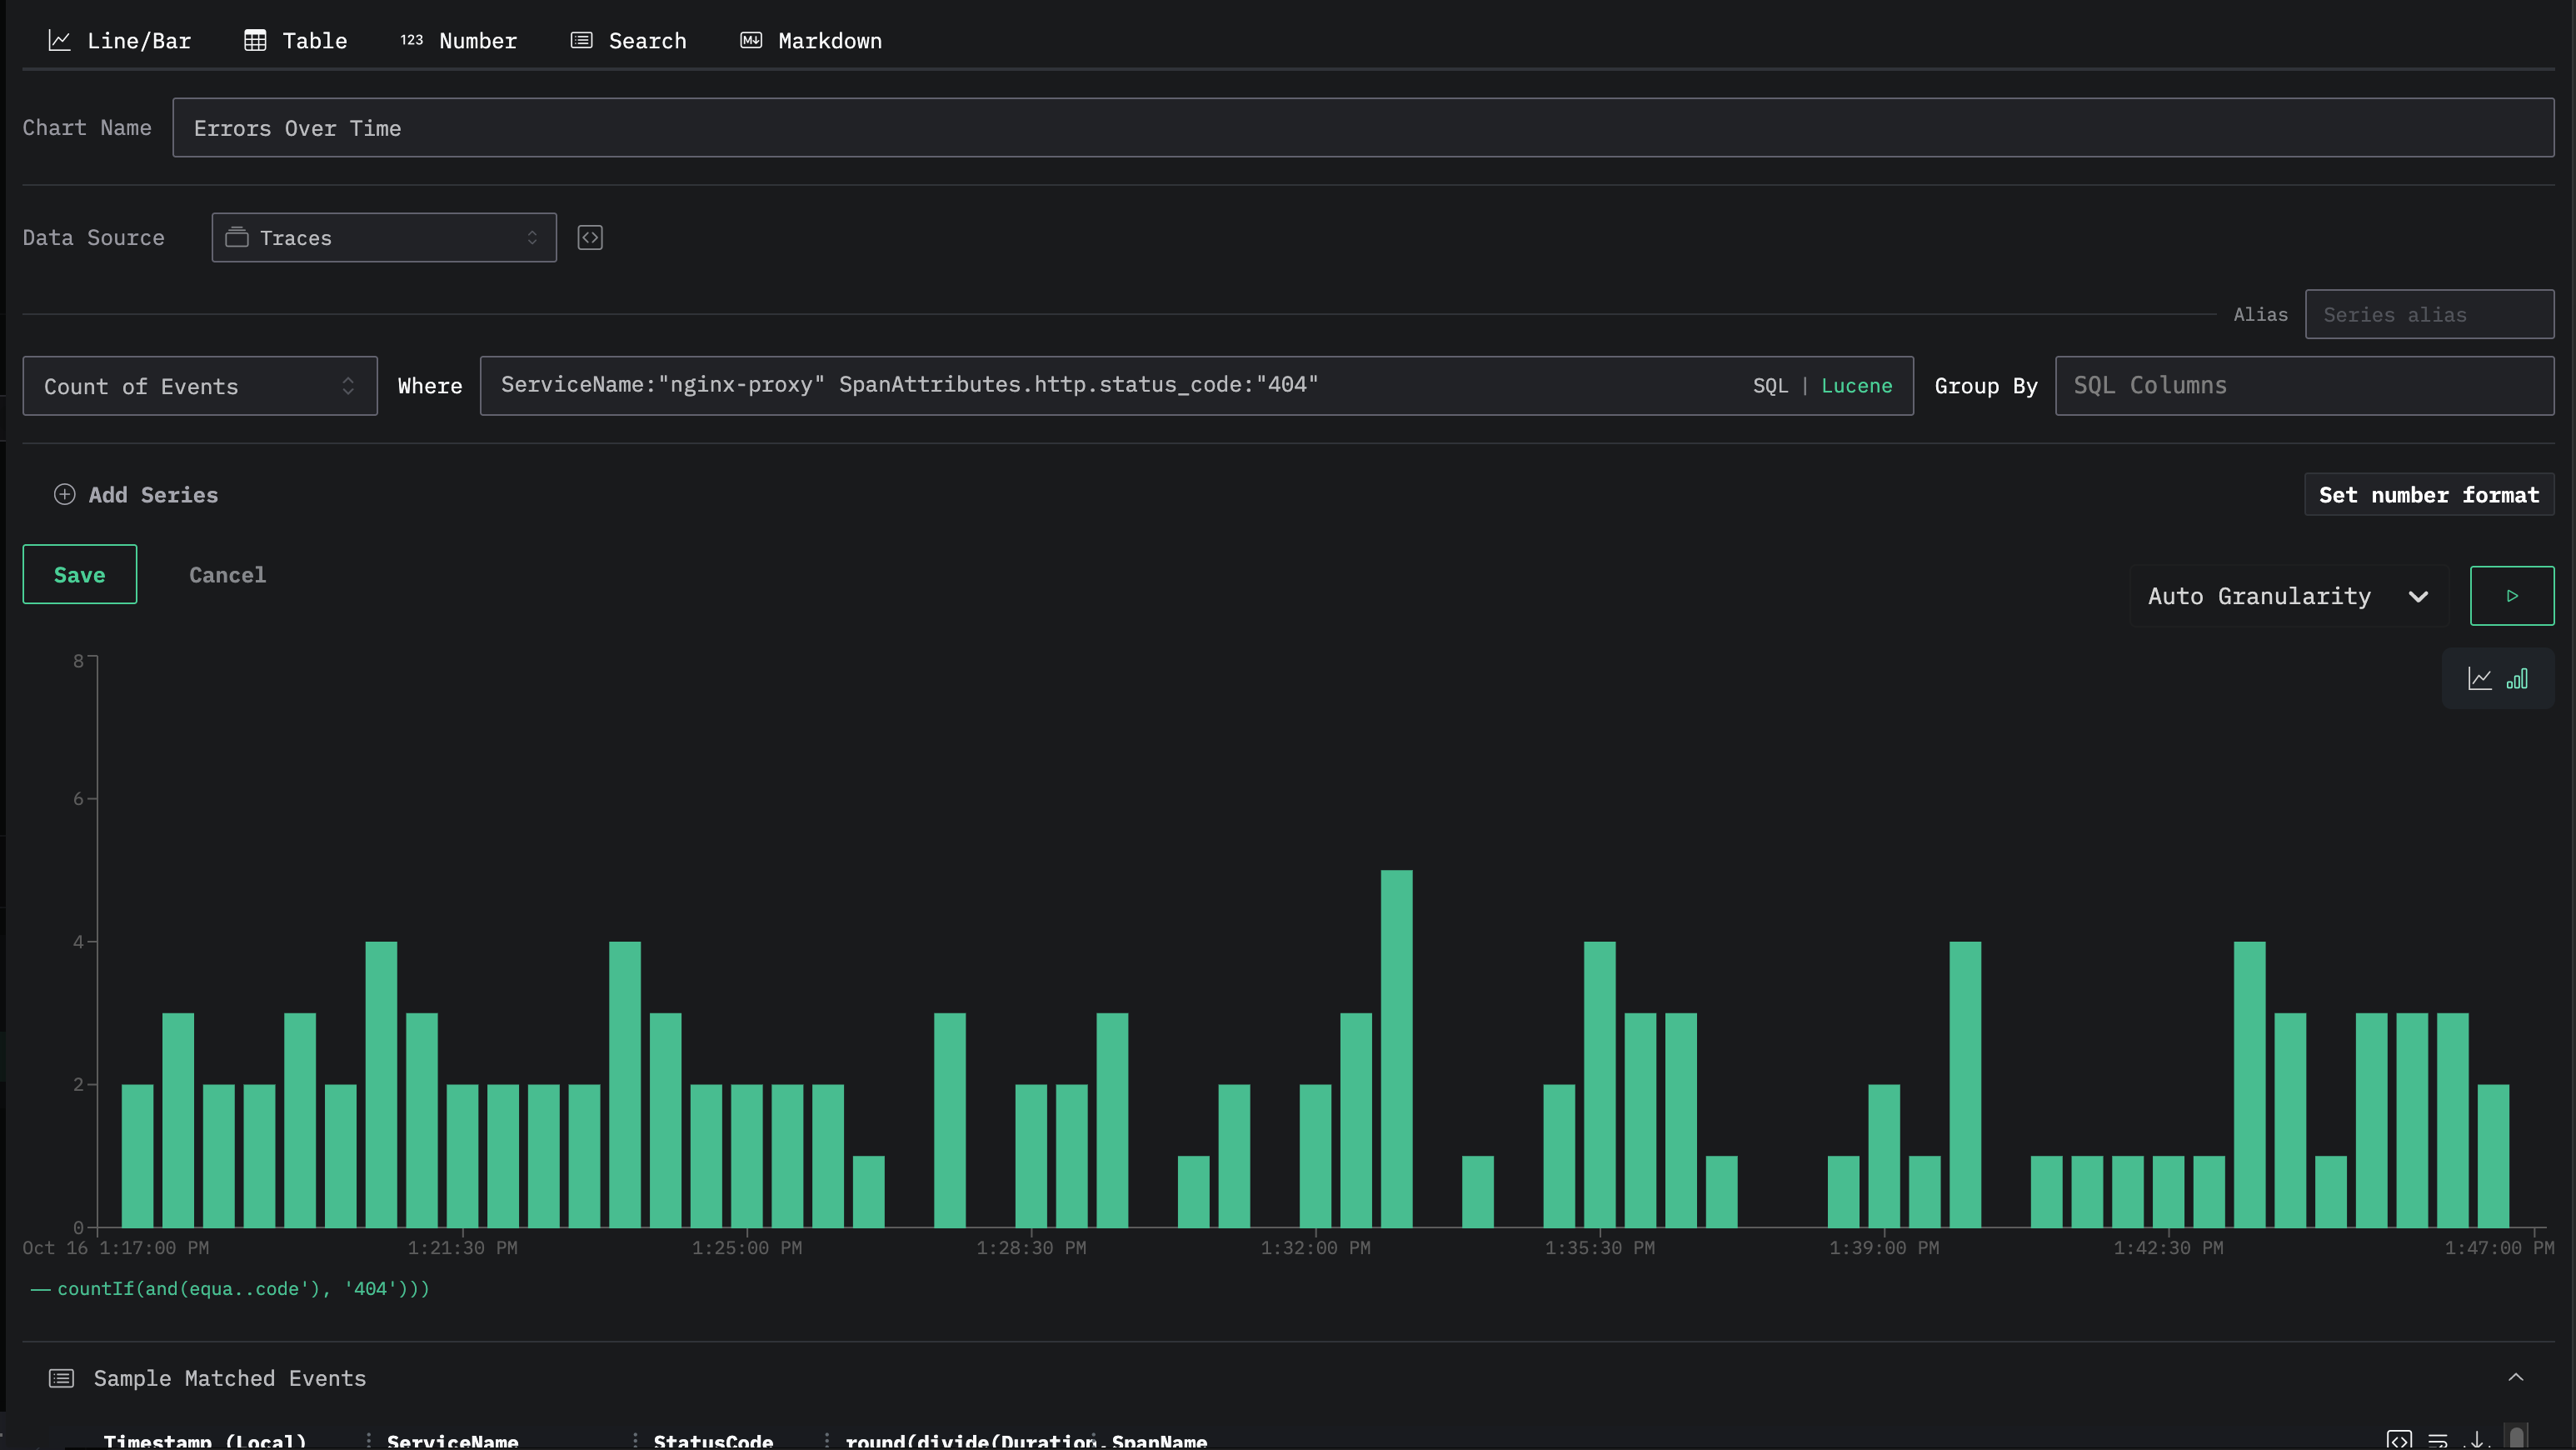
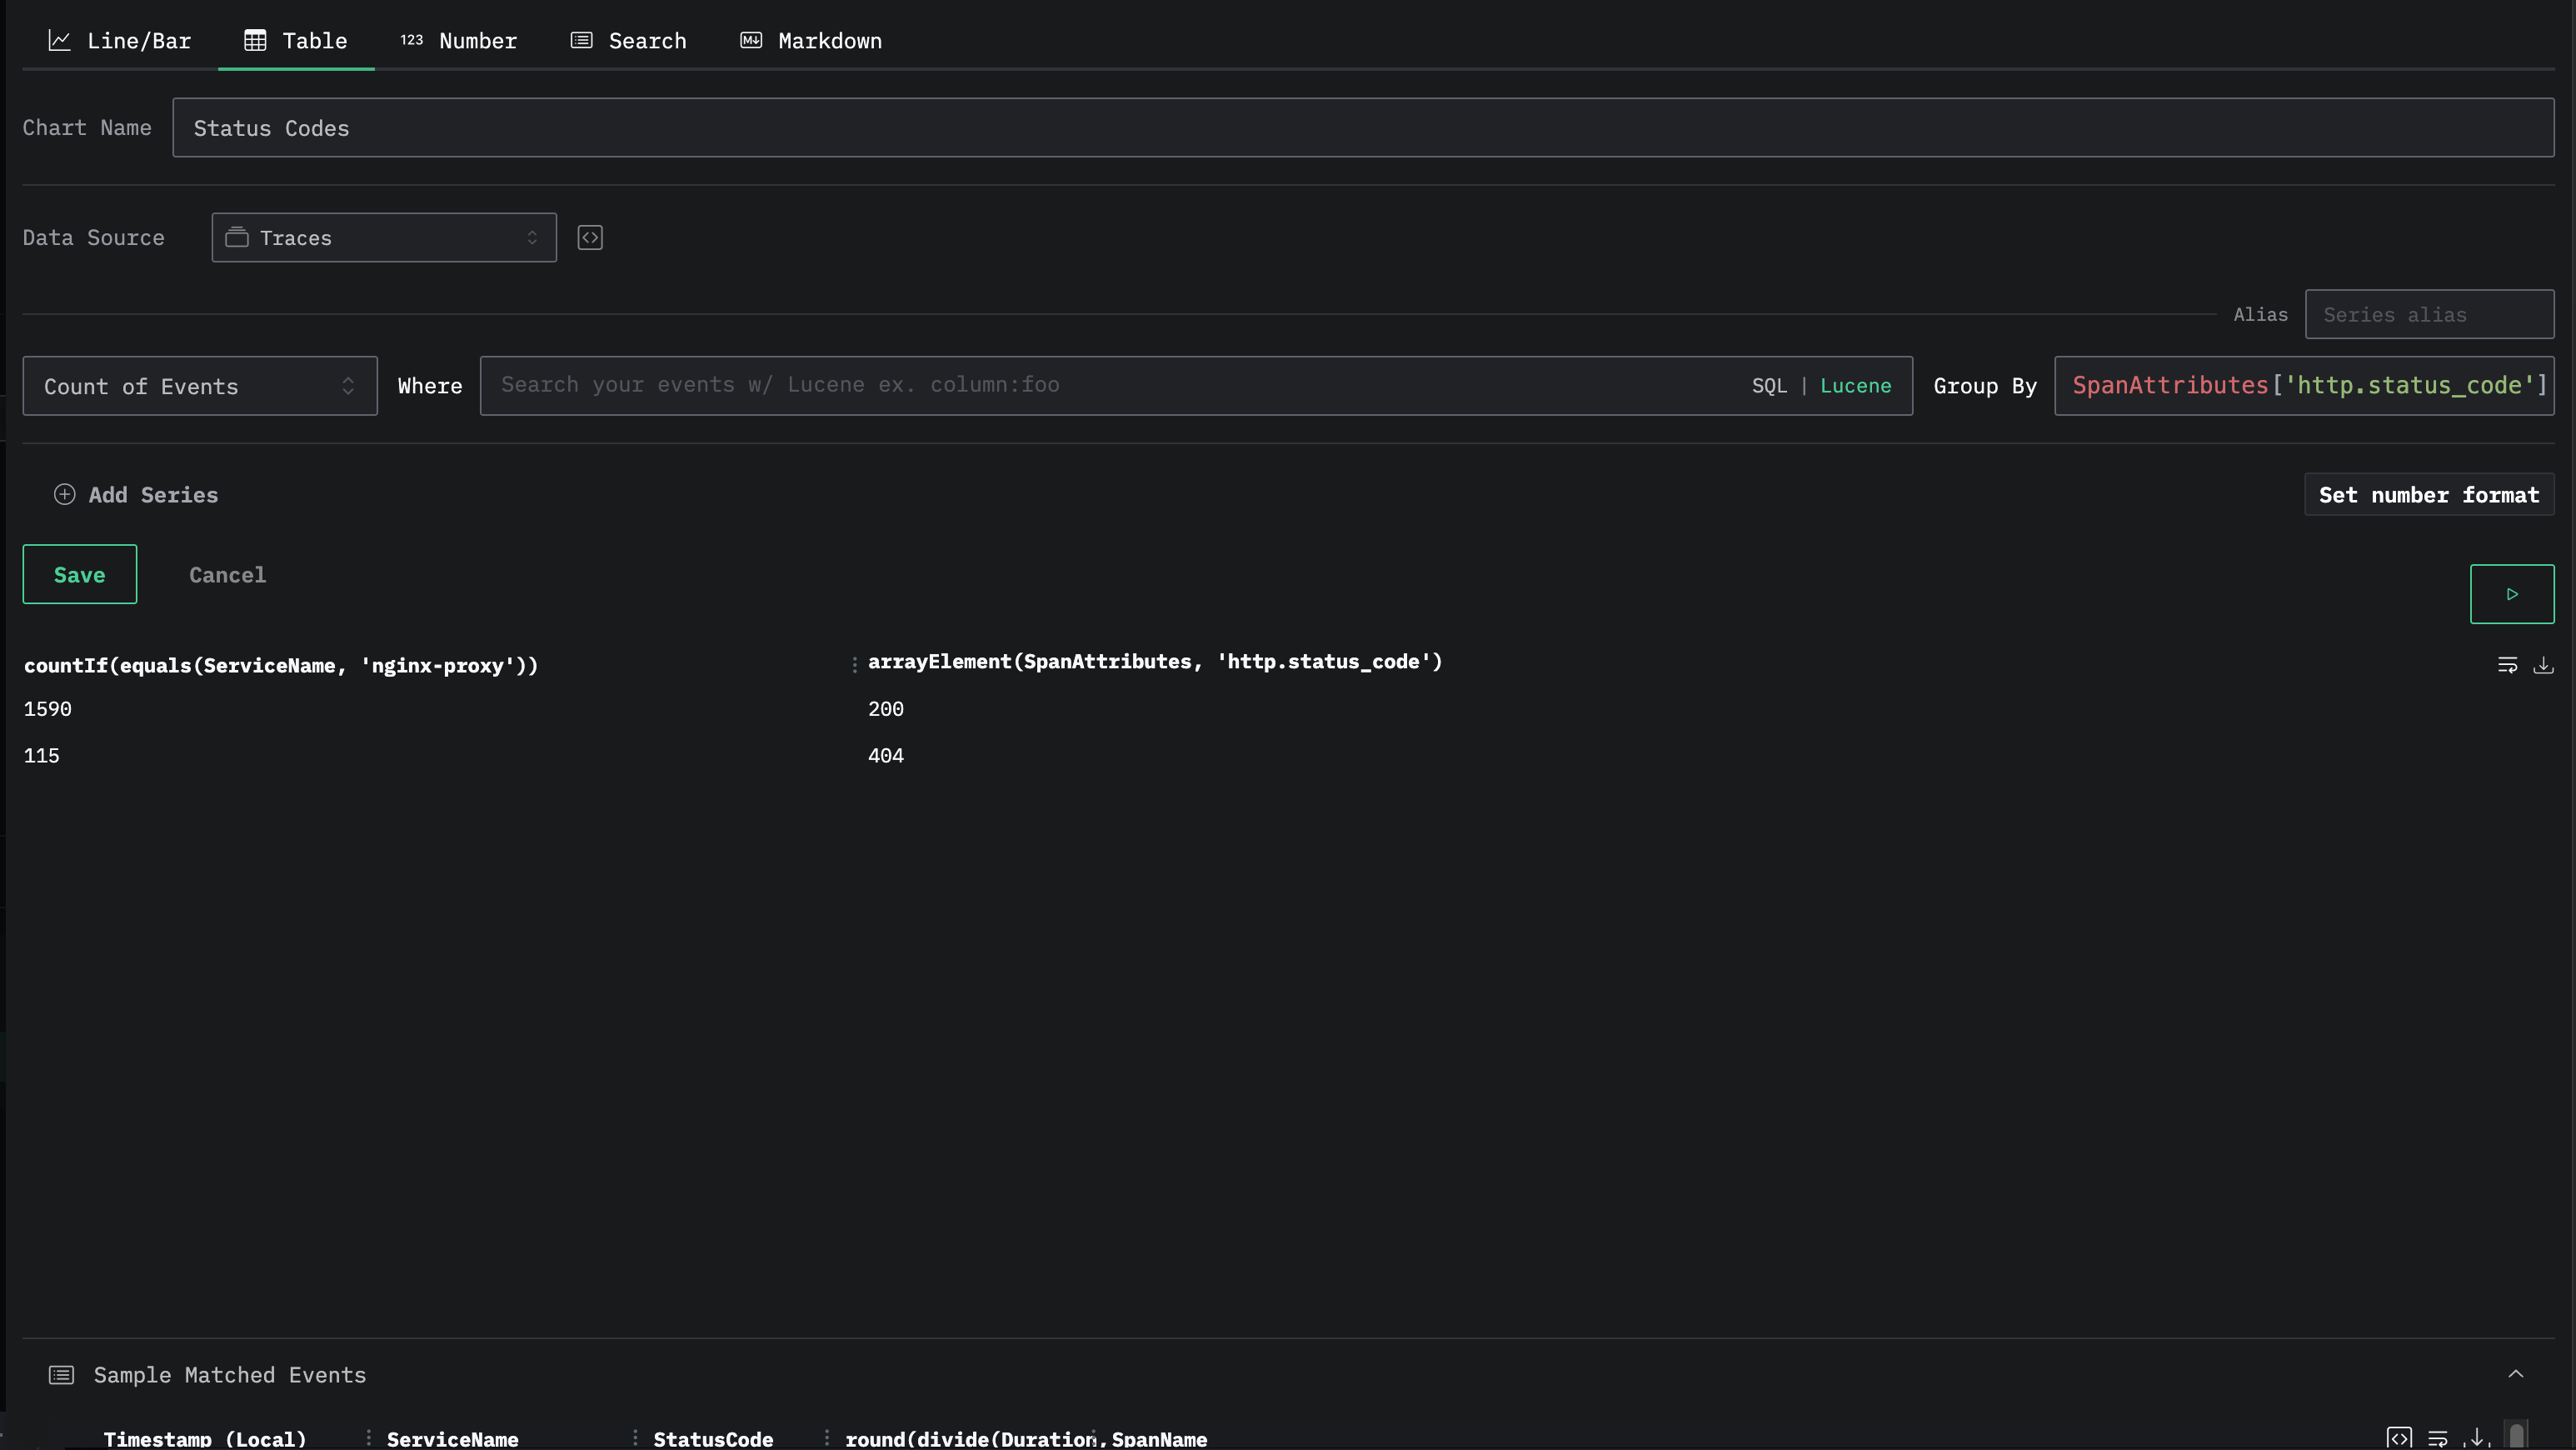
Chart 4: Status Code Breakdown

  • Type: Table
  • Where: ServiceName:"nginx-proxy"
  • Aggregation: Count of Events
  • Group by: SpanAttributes['http.status_code']

Next steps

Now that you have traces going, try:

  • Setting up alerts
  • Adding your own service
    • Replace Fake Store API with your own backend
    • Add OpenTelemetry to your backend for full distributed tracing
    • See requests flow to your instance